

Note:
obsRis an independent tool developed by Julio Rabadán-González (National Coordinator for Observation.org Spain, and Somms Multimedia Solutions SL). It is a personal initiative created with the knowledge and blessing of Observation.org, though it is not directly funded or supported by Observation International. Observation.org is a registered trademark of its respective owners.
Overview
obsR is an R package designed to simplify the access, preparation, and analysis of data exported from the citizen science platform Observation.org.
Whether you are an ecologist, a data analyst, or a conservation researcher, obsR removes the technical barriers of working with raw Observation.org exports. It seamlessly reads SQLite, CSV, or Excel files and transforms them into clean, analysis-ready data frames. You do not need to write SQL queries or memorise the intricacies of the export schema: obsR handles the heavy lifting, providing standardised columns for validation, phenology, sex, life stage, and more.
Key Features
-
Format Agnostic: Read SQLite, CSV, or Excel exports using a single, consistent function (
obs_read()). - Analysis-Ready Output: Automatically standardises column names and decodes categorical variables (e.g., validation status, sex, life stage) regardless of the export language.
-
Built-in Visualisation: Generate publication-ready maps and phenology charts with dedicated, easy-to-use functions (
obs_map(),obs_plot()). -
Privacy by Design: Includes tools like
obs_anonymise()to safely hash observer details before sharing or publishing data, aligning with FAIR data principles. - Efficient Data Handling: Supports lazy loading for large SQLite exports, allowing you to filter data before loading it entirely into memory.
Installation
# Install the remotes package if you haven't already
install.packages("remotes")

# Install obsR from Codeberg
remotes::install_git("https://codeberg.org/sommsnet/obsR.git")
Quick Start
library(obsR)

# 1. Load a sample dataset (or point to your own export file)
sparrows <- obs_read(obs_example_db())

# 2. Get a quick summary of the data
obs_summary(sparrows)

# 3. Visualise the data
obs_map(sparrows, color = "scientific_name", basemap = "outline")
obs_plot(sparrows, "phenology")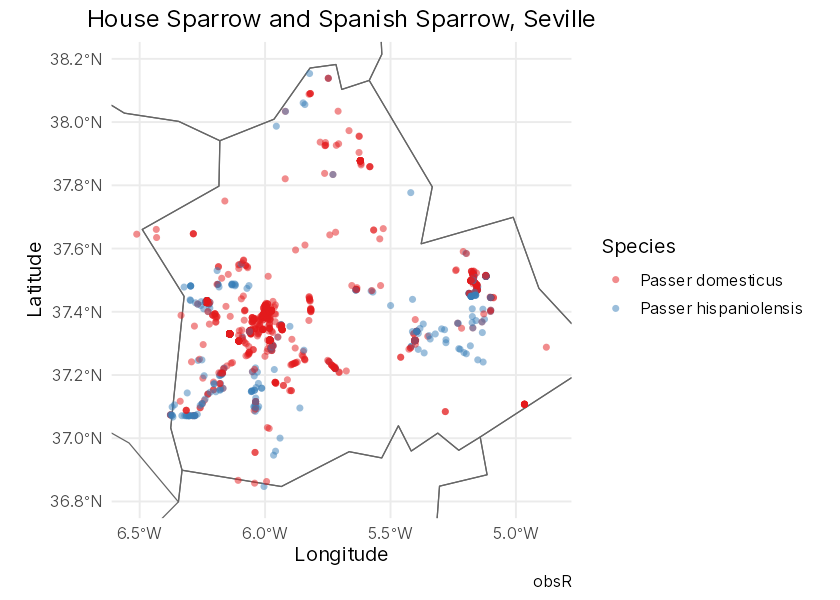
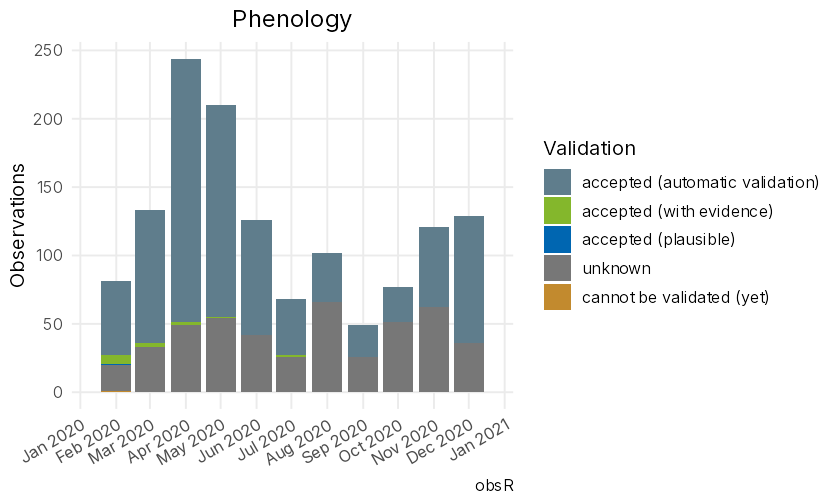
Core Workflows
1. Importing and Filtering Data
Use obs_read() to import your data. You can filter by date or species directly during import, which is especially efficient for large SQLite files.
# Filter by date and species during import
house_sparrows <- obs_read("export.sqlite",
                           species = "Passer domesticus",
                           date = c("2020-01-01", "2020-12-31"))
Tip: If a filter returns no matches, obs_read() will warn you. Use obs_species() to check valid names or IDs before querying.
2. Visualising Observations
Create meaningful visualisations with minimal code. Static maps use ggplot2, while interactive maps leverage leaflet (automatically clustering markers for datasets with >1,000 points).
# Static map with simplified administrative boundaries for geographic context
obs_map(sparrows, color = "validation", basemap = "outline")

# Interactive map
obs_map(sparrows, color = "sex", type = "interactive")

# Phenology, activity, and species plots
obs_plot(sparrows, "phenology")
obs_plot(sparrows, "activity")
Technical Notes
-
Locale Handling: Header names in CSV and Excel exports are standardised in English, but categorical values may appear in Spanish or English depending on the export settings. The
localeargument inobs_read()(e.g.,locale = "en") ensures consistent, English output labels regardless of the source file’s language. -
Lazy Evaluation: For large SQLite exports,
obs_read()employs lazy evaluation (defaultcollect = 100,000). Larger datasets remain as lazy queries until you callobs_collect()or setcollect = TRUE. CSV and Excel files are always loaded into memory immediately. -
Mixed Counts: Observation.org allows users to record a total count (e.g., “20 individuals”) while explicitly detailing the subgroup composition (e.g., “2 adult males, 5 adult females, and 13 juveniles”), specifying sex, life stage, and activity.
obsRcaptures these mixed counts (currently supported in SQLite exports) and provides theobs_expand()function to unpack them into individual observation rows for granular analysis. -
Optional Privacy Tools: Citizen science data often requires careful handling of personal information. For users who wish to share or publish their datasets,
obsRprovides the optionalobs_anonymise()function to safely replace observer names and IDs with a one-way hash. -
Column Mapping:
obsRstandardises key fields for immediate usability. For example, the codedvalidation_code(A/J/P/O/N/U/I) is accompanied by a human-readablevalidationcolumn. Refer to the Function Reference for a complete column mapping guide.
Documentation
The site is at https://docs.obsr.somms.net/.